


Weather monitoring and forecasting were among the first civilian uses of satellite remote sensing. This began with TIROS-1 (Television and Infrared Observation Satellite – 1), the first true weather satellite, launched by the United States in 1960. Over the next five years, more weather satellites were sent into space, following near-polar orbits. These satellites provided repeated observations of weather patterns across the globe.
A major breakthrough came in 1966 when NASA launched the Applications Technology Satellite (ATS-1). This was a geostationary satellite, meaning it stayed fixed over one part of the Earth, capturing images of the Earth’s surface and cloud cover every 30 minutes. For the first time, scientists could regularly track the formation and movement of weather systems, improving weather predictions.
Today, many countries operate weather satellites to monitor global weather conditions. These satellites have sensors that cover large areas but with less detail compared to land observation satellites. However, they capture frequent images, allowing scientists to continuously track changes in weather, cloud cover, and atmospheric moisture, which is crucial for accurate forecasting.
Now, let’s look at some important satellites and sensors used for weather monitoring, starting with GOES (Geostationary Operational Environmental Satellites).
GOES Weather Satellites: Watching the Weather from Space
The Geostationary Operational Environmental Satellite (GOES) System is a series of advanced weather satellites designed by NASA for the National Oceanic and Atmospheric Administration (NOAA). These satellites help the U.S. National Weather Service by providing frequent, high-detail images of Earth’s surface and cloud cover. For over 20 years, meteorologists have relied on GOES satellites to monitor and predict the weather.
How GOES Satellites Work
GOES satellites are part of a global network of weather satellites placed 70° apart in longitude, ensuring nearly worldwide coverage. There are two main GOES satellites in space:
- GOES-East (at 75°W longitude) – Covers North and South America and most of the Atlantic Ocean.
- GOES-West (at 135°W longitude) – Monitors North America and the Pacific Ocean basin.
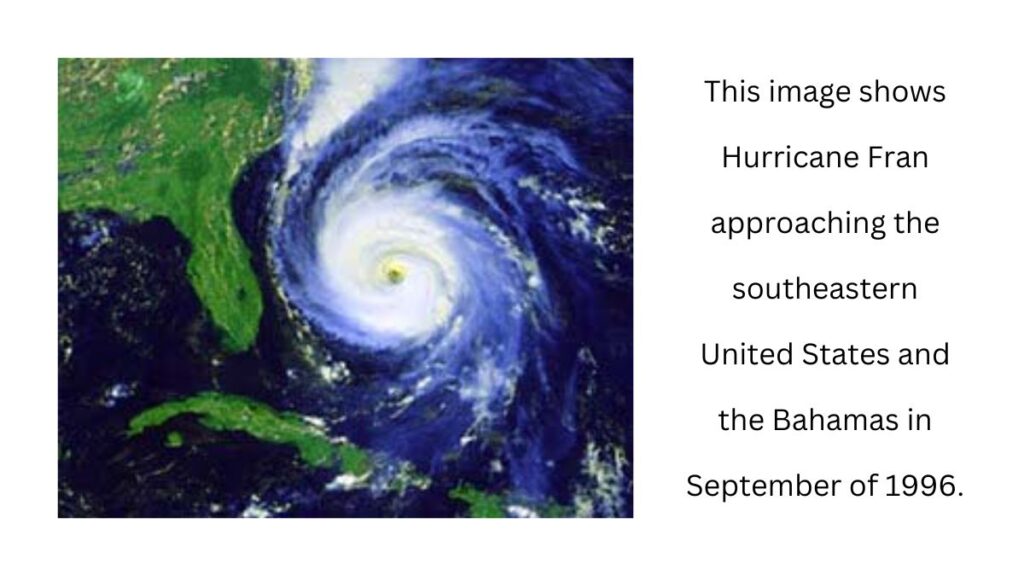
Together, these satellites observe a vast area from 20°W to 165°E longitude, capturing critical weather patterns. For example, in September 1996, a GOES satellite captured images of Hurricane Fran moving toward the southeastern United States and the Bahamas.
The Evolution of GOES Satellites
There have been two generations of GOES satellites:
- First Generation (GOES-1 to GOES-7, launched between 1975–1992)
- These satellites could only observe Earth for about 5% of the time due to their design limitations.
- Second Generation (GOES-8 and beyond, launched from 1994 onwards)
- These satellites brought major technological improvements, allowing continuous observation of Earth.
- They provide more frequent images (as often as every 15 minutes), improving weather forecasting accuracy.
Key Features of GOES Satellites
- Separate Imaging & Sounding Instruments:
- The Imager has five channels that detect visible and infrared radiation, allowing both day and night imaging.
- The Sounder helps measure atmospheric temperature, winds, and moisture.
- Flexible Scanning Options:
- Can capture entire hemispheres or zoom in on specific areas for more detailed monitoring of severe weather.
- Improved Data Transmission:
- High-quality 10-bit resolution images can be sent directly to meteorologists on Earth.
With these advancements, GOES satellites continue to be a crucial tool for weather prediction, helping scientists track storms, hurricanes, and climate patterns with greater accuracy.
GOES Bands
| Band | Wavelength Range (μm) | Spatial Resolution | Application |
| 1 | 0.52 – 0.72 (visible) | 1 km | Cloud, pollution, and haze detection; severe storm identification |
| 2 | 3.78 – 4.03 (shortwave IR) | 4 km | Identification of fog at night; discriminating water clouds and snow or ice clouds during daytime; detecting fires and volcanoes; nighttime determination of sea surface temperatures |
| 3 | 6.47 – 7.02 (upper level water vapour) | 4 km | Estimating regions of mid-level moisture content and advection; tracking mid-level atmospheric motion |
| 4 | 10.2 – 11.2 (longwave IR) | 4 km | Identifying cloud-drift winds, severe storms, and heavy rainfall |
| 5 | 11.5 – 12.5 (IR window sensitive to water vapour) | 4 km | Identification of low-level moisture; determination of sea surface temperature; detection of airborne dust and volcanic ash |
NOAA AVHRR: A Key Tool for Weather and Earth Monitoring
NOAA (National Oceanic and Atmospheric Administration) operates a series of satellites that help in weather forecasting and environmental monitoring. These satellites follow a sun-synchronous, near-polar orbit about 830-870 km above Earth, meaning they pass over the same areas at the same time every day. They belong to the Advanced TIROS series, which has been around since 1960, and work alongside geostationary satellites like GOES to provide continuous global coverage.
At any given time, two NOAA satellites are in operation. One crosses the equator in the early morning, moving north to south, while the other crosses in the afternoon. This setup ensures that weather and environmental data for any location is updated at least every six hours.
What is AVHRR Weather Satellites?
The Advanced Very High Resolution Radiometer (AVHRR) is the main sensor on NOAA satellites. It captures radiation from Earth in visible, near-infrared, mid-infrared, and thermal infrared wavelengths. With a wide 3,000 km swath, AVHRR provides large-scale observations of Earth’s surface and atmosphere.
How is AVHRR Data Used?
AVHRR data is essential for:
Weather forecasting – Helps track cloud patterns, storms, and temperature changes.
Monitoring land and vegetation – Maps forests, farmlands, and natural vegetation health.
Tracking sea surface temperature – Identifies ocean currents, temperature variations, and climate patterns.
Environmental studies – Monitors droughts, wildfires, and changes in Earth’s surface.
Data Transmission and Processing
AVHRR data can be received in four different formats, depending on resolution and transmission method. The data can be sent directly to Earth in real-time or stored onboard for later transmission. Scientists use this information for both immediate weather forecasting and long-term environmental monitoring.
AVHRR in Action
Even though AVHRR has a coarser spatial resolution than some modern land observation satellites, it is widely used for regional studies. Large-scale images, called mosaics, are created by combining multiple AVHRR datasets.
A great example of AVHRR’s practical use is in Canada, where the Prince Albert Receiving Station in Saskatchewan uses AVHRR data to monitor grain crop health in the Prairies throughout the growing season.
NOAA AVHRR Bands
| Band | Wavelength Range (μm) | Spatial Resolution | Application |
| 1 | 0.58 – 0.68 (red) | 1.1 km | Cloud, snow, and ice monitoring |
| 2 | 0.725 – 1.1 (near IR) | 1.1 km | Water, vegetation, and agriculture surveys |
| 3 | 3.55 – 3.93 (mid IR) | 1.1 km | Sea surface temperature, volcanoes, and forest fire activity |
| 4 | 10.3 – 11.3 (thermal IR) | 1.1 km | Sea surface temperature, soil moisture |
| 5 | 11.5 – 12.5 (thermal IR) | 1.1 km | Sea surface temperature, soil moisture |
AVHRR Data Formats
| Format | Spatial Resolution | Transmission and Processing |
| APT (Automatic Picture Transmission) | 4 km | Low-resolution direct transmission and display |
| HRPT (High Resolution Picture Transmission) | 1.1 km | Full-resolution direct transmission and display |
| GAC (Global Area Coverage) | 4 km | Low-resolution coverage from recorded data |
| LAC (Local Area Coverage) | 1.1 km | Selected full-resolution local area data from recorded data |
Other Weather Satellites
Apart from the commonly known weather satellites, the United States operates the Defense Meteorological Satellite Program (DMSP), which helps monitor weather conditions from space. These satellites follow a near-polar orbit, meaning they travel from the North Pole to the South Pole, covering almost the entire Earth.
One of the key features of DMSP satellites is their Operational Linescan System (OLS) sensor, which captures images twice a day over a wide area of 3000 km with a 2.7 km resolution. The sensor works in two main wavelength bands:
- Visible and Near Infrared (0.4 to 1.1 μm) – Helps capture daytime images.
- Thermal Infrared (10.0 to 13.4 μm) – Detects heat and is useful for weather analysis.
A fascinating feature of this sensor is its ability to capture nighttime images, even under extremely low light conditions. This means it can take stunning pictures of Earth at night, showing glowing city lights from space!
Weather Satellites from Other Countries
Many other countries also operate weather satellites:
- Japan has the GMS (Geostationary Meteorological Satellite) series, which is positioned over Japan and captures images every 30 minutes. It has two bands:
- Visible band (0.5 to 0.75 μm) – Captures high-resolution images (1.25 km resolution).
- Thermal Infrared band (10.5 to 12.5 μm) – Helps detect temperature differences (5 km resolution).
- Europe operates the Meteosat series, positioned over the equator above Europe. It has three bands:
- Visible band (0.4 to 1.1 μm) – Provides images with 2.5 km resolution.
- Mid-Infrared (5.7 to 7.1 μm) – Helps detect water vapor (5 km resolution).
- Thermal Infrared (10.5 to 12.5 μm) – Measures heat patterns (5 km resolution).
These satellites play a crucial role in weather forecasting, disaster monitoring, and climate research, helping scientists track storms, temperature changes, and even urban development through satellite imagery.


